User manual
This manual explains how to use OPTamos in multi-criteria decision making. This is a practical overview of how this tool works. If you want to learn more about the methodology behind this tool, read more here.
Step 1: Create a new project
If you don't have one already, create an account for our platform. Once you are logged into your account, there is a "Projects" option in the menu. You can create a new project in this section by clicking the "+ New Project" button. You will see the following form:
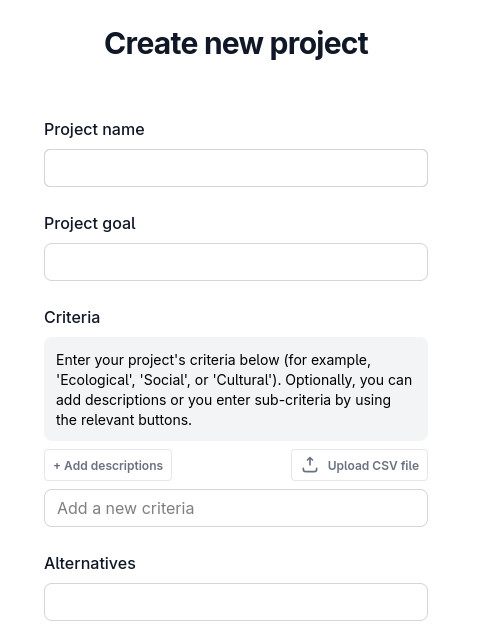
The following fields should be filled out:
- Project name: a short name to describe your project.
- Project goal: a sentence to describe what the goal is for your project (e.g. To decide on the transformation for Lot 84).
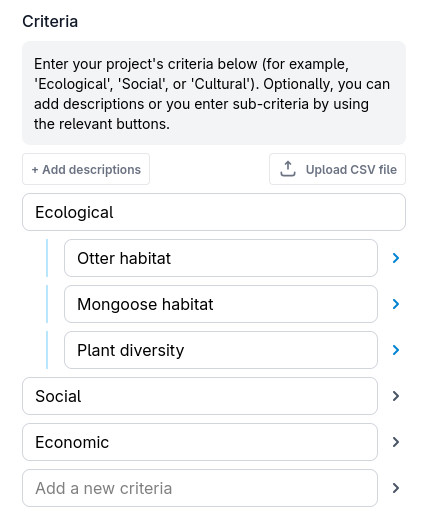
- Criteria: enter each criteria that is part of your evaluation process. Try to use single-word or otherwise short phrases here (e.g. Ecological). Every time you fill out one field, a new, empty field appears automatically in order for you to keep adding options. Please note that you can also add a description (use the "+ Add descriptions" button to add them). It is furthermore possible to make not just a single-level list of criteria, but to also add sub-criteria (for instance Otter habitat as a sub-criterion of Ecological). To make any one of the criteria a sub-criterion, click the right-hand arrow next to it. You can click it again to undo this. The arrow will only appear for the 2nd criterion onwards, because every sub-criterion needs to have a 'parent' above it. The image below shows an example of this.
- Alternatives: the different alternatives that you are evaluating (for instance Build a park, Create a cultural centre, Cattle farming).
- Meta data: this is an optional section to enter meta data about your project, as you see fit.
Once you save your information, your project is created! If you have a single-user, straightforward project, then this might be all you need to do. However, there are some more advanced settings available if you need them.
Optional: Managing a team
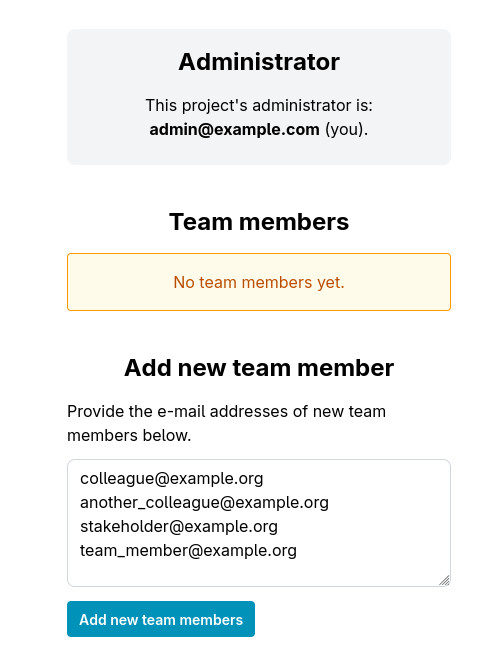
OPTamos is set up in a way that it can be used by a single user or by a group of people. By default, any new project is set up to only give you - the user that created the project - access to it. However, you might want to involve others that give their own evaluation of the criteria and the alternatives. To do this, you have to add them as team members. To do so, you can click the link at the top of the page that you see right after creating a project:

Please note that while you will only see this text when you first create a project, but you can always manage a team by going to the MANAGE PROJECT section.
To add team members you simply add their e-mail address in the box that is shown. Enter one address on each line, and click the button below the box to give these people access to the project.
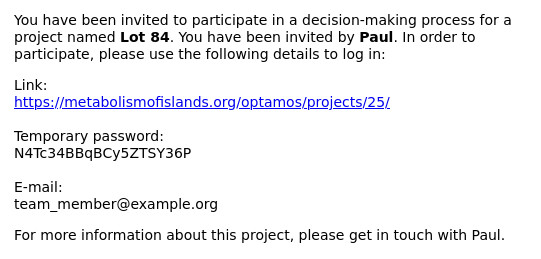
Each team member will be sent an e-mail to inform them that they have been added to the project. They can follow the link in the e-mail to create their account, and once they do this, they will automatically have access to the project. If a user already has an account then they will simply receive an e-mail notification that their existing account now has access to a new project.
You can remove team members at any time by clicking the delete icon next to their e-mail address.
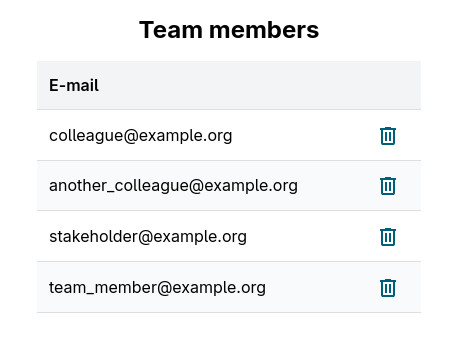
Important: anyone who is invited as part of your team will be able to fill out their own criteria rankings, but they can NOT change the project settings. They should be seen as participants in the analysis, but not as administrators of the project. Only you (as the person who created the project) can edit the project itself. For this reason it makes sense to only invite people once you have confirmed that everything in the project is looking good and it is ready for people to participate in.
Step 2: Recording rankings
At the core of an AHP analysis is the pair-wise comparison of different options. This means looking at two items (be it criteria or alternatives) and evaluating ONLY those two in that moment. This is what is being done for a number of different elements in the project. Read more here about the methodology.
There are two types of rankings to record: criteria rankings and alternative rankings.
Ranking criteria
To rank criteria refers to indicating how much you value different criteria. Do you care more about Social compared to Ecological? Do you care more about Economic or Ecological? It is important to note that you are always looking at two items at the same time - you are only evaluating individual pairs at one time, not the entire list of options.
When you open a project, you will immediately see the page where you can compare all the criteria. The evaluation will list all the different pairs for your project.
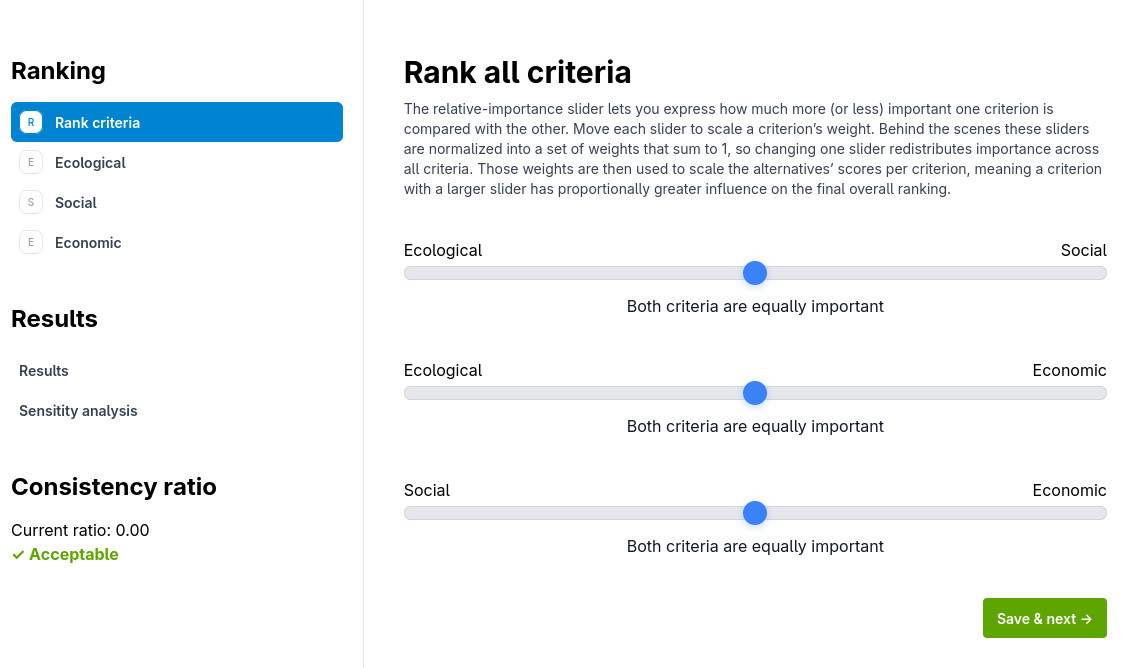
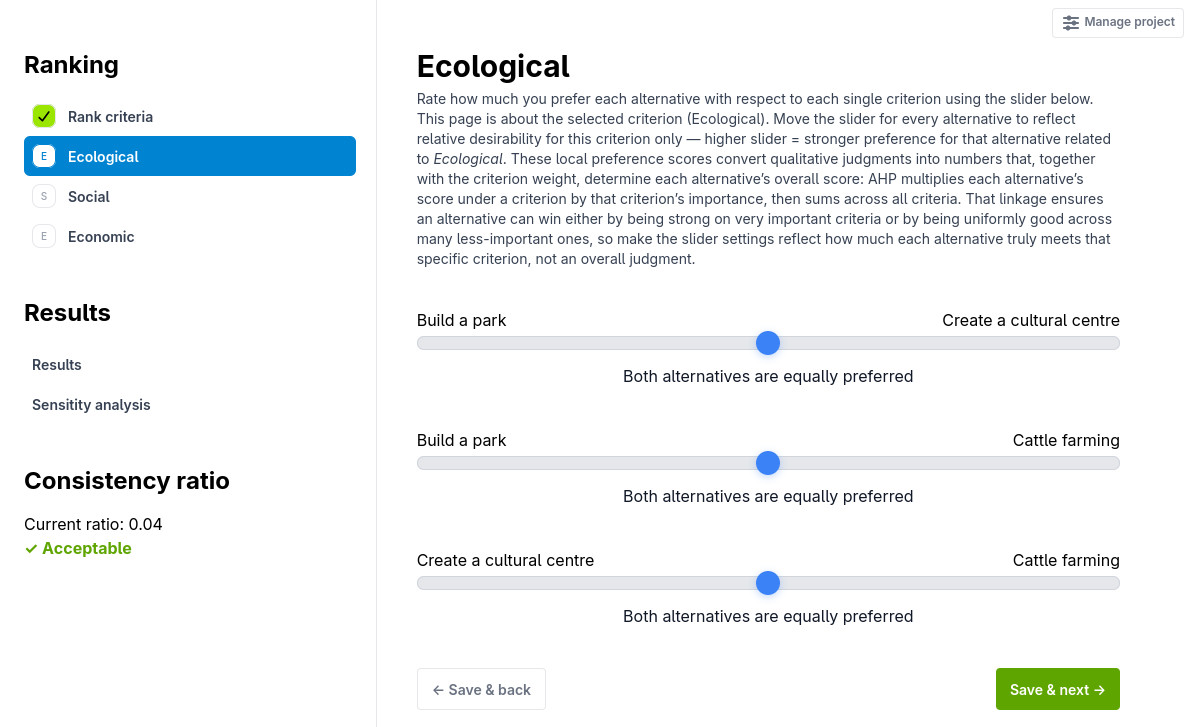
You rank all the pairs by moving the slider in the direction of the criterion that is most important to you. The more you move the slider, the more important that criterion becomes. Underneath the slider you will see a description of how the importance is ranked. You can move it up to 8 steps into either direction. If you find both criteria equally important, leave the slider in the center. Once you are happy with your rankings, save the page.
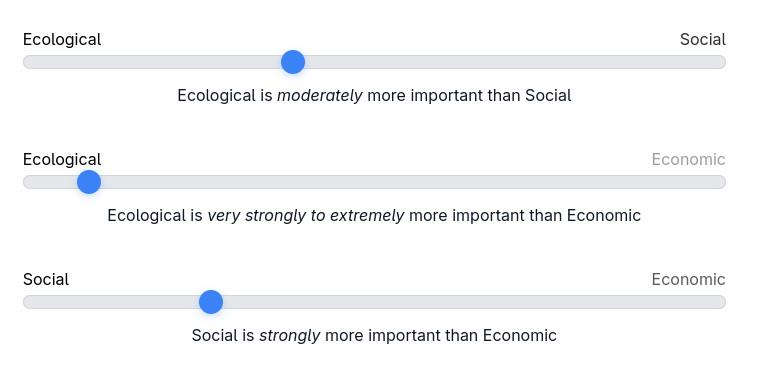
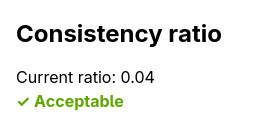
After you save your criteria rankings, it is important to have a look at the "Consistency ratio" shown on the left-hand side of the screen. This indicators tells you whether or not you are sufficiently consistent in your rankings. If you provide contradictory rankings, the system will inform you of this and you are recommended to revisit the previous page to review your criteria rankings.
Ranking alternatives
After you compare criteria, you will be asked to do a similar comparison for your different alternatives. However, you will be ranking the alternatives through a specific criterion lens. You do this one criterion at a time. For instance, below is the example of ranking alternatives when looking at it from an Ecological angle:
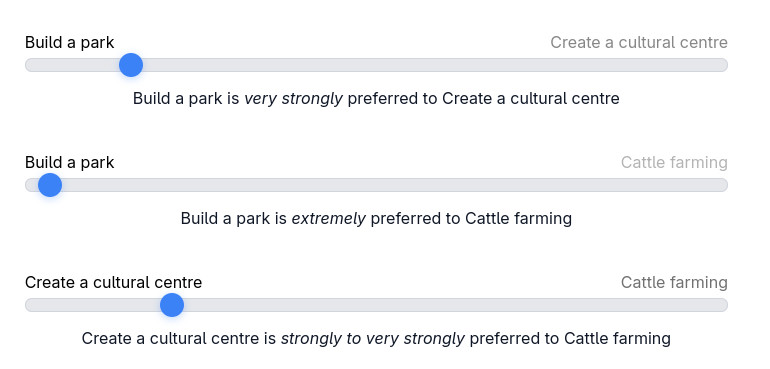
If you look at the alternatives from this angle, you might want to classify your options as follows:
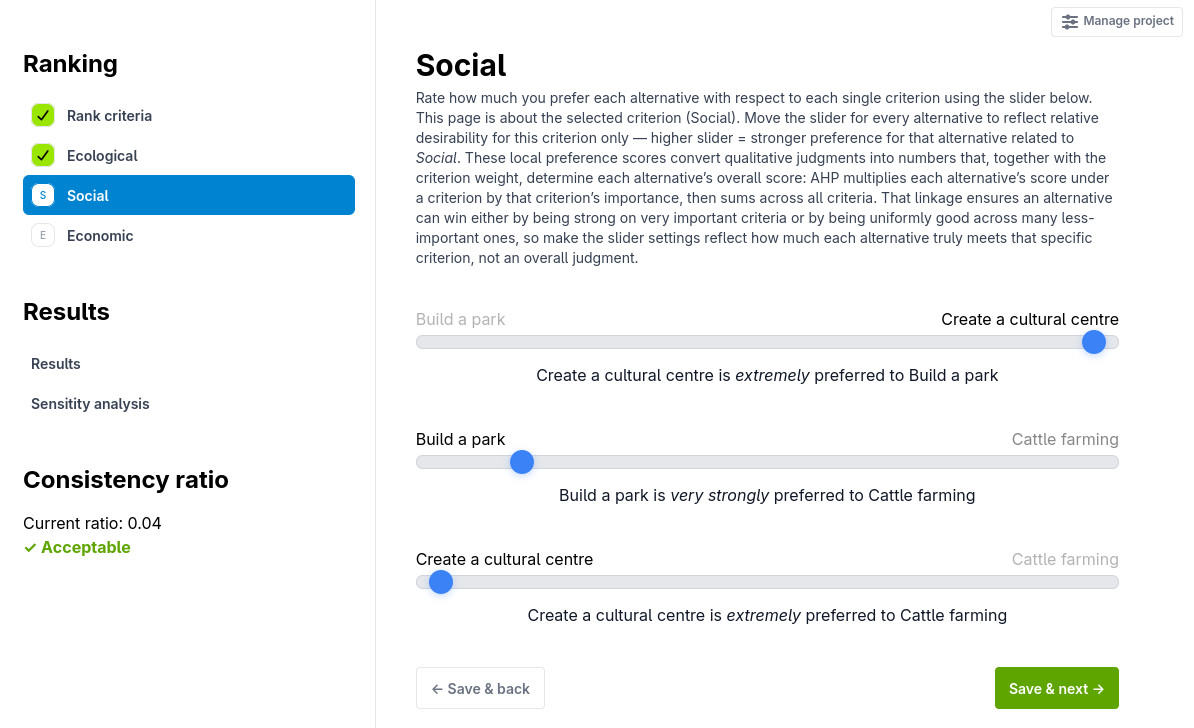
Once you record these rankings, you will automatically be taken to the next criterion for rankings. You again fill out your preference for different alternatives but now you take a different criterion into account. For instance, from an Social perspective, you might fill it out like this:
Continue filling out the rankings until you have done all of them.
Step 3: View results
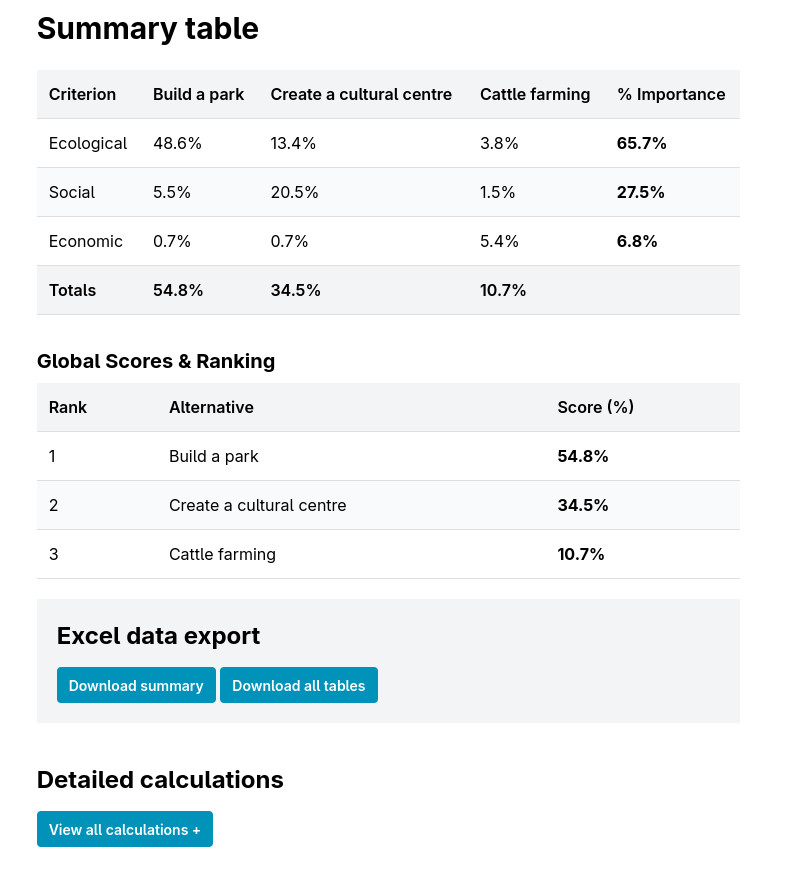
Once you have filled out all the rankings, the system will provide you with the results. The results are automatically calculated based on your rankings, and they will present two things:
- A ranking of all the alternatives, indicating in which order the alternatives are preferred based on all your inputs.
- A ranking of the criteria, to indicate how much importance is given to each criterion, based on your criteria ranking
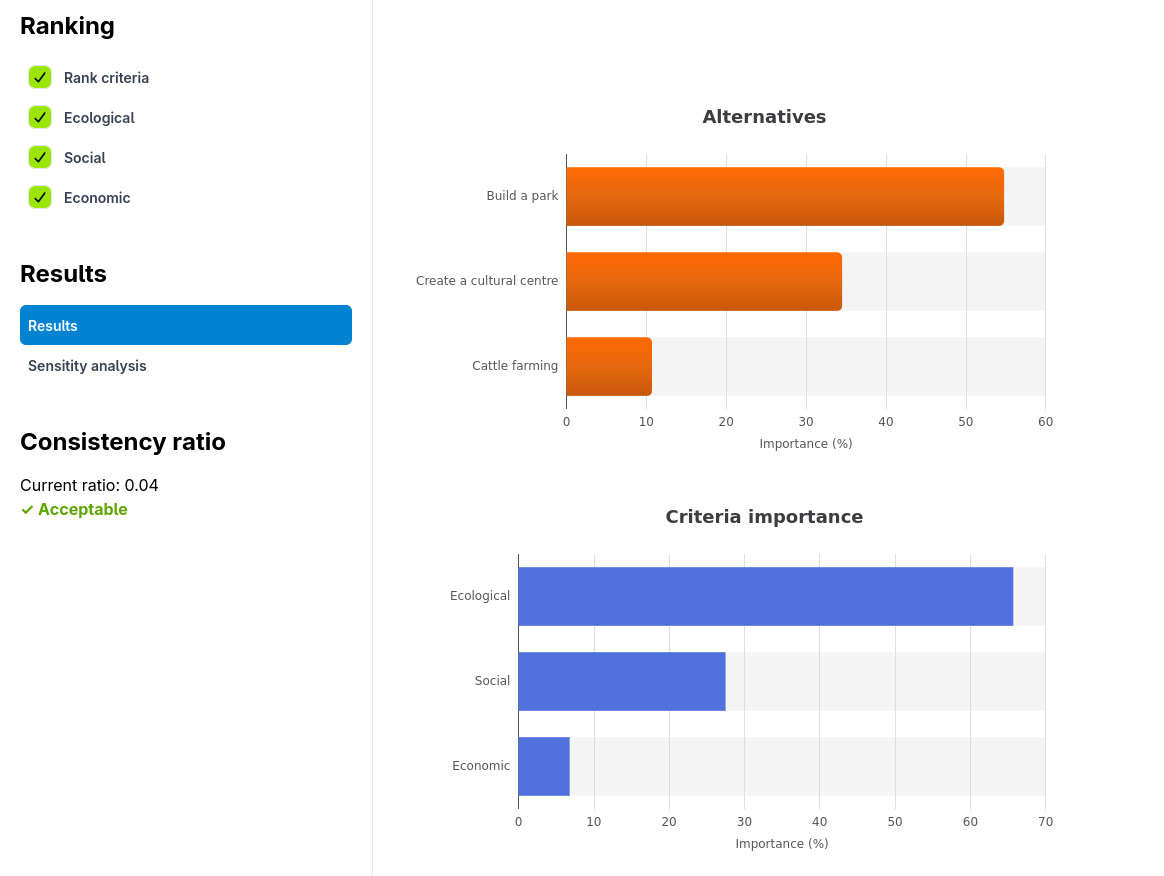
In addition to the charts, there are additional tables available on the same page. They include a summary overview of the information displayed in the charts, but there are also detailed calculations available (click the "View all calculations" button). The information can also be downloaded and saved in spreadsheet format (either the summary or all the calculations).
Step 4: Sensitivity analysis
Sensitivity analysis shows how stable the decision is when the importance of criteria changes. By moving a slider, you can increase or decrease the importance of a specific criterion and immediately see how the overall rankings respond. As one criterion becomes more important, the system automatically adjusts the importance of the remaining criteria so that the total importance stays balanced. This helps you explore “what-if” scenarios and understand which criteria have the biggest influence on the final result. You can freely play around with these sliders - this will not change your saved preferences and results.
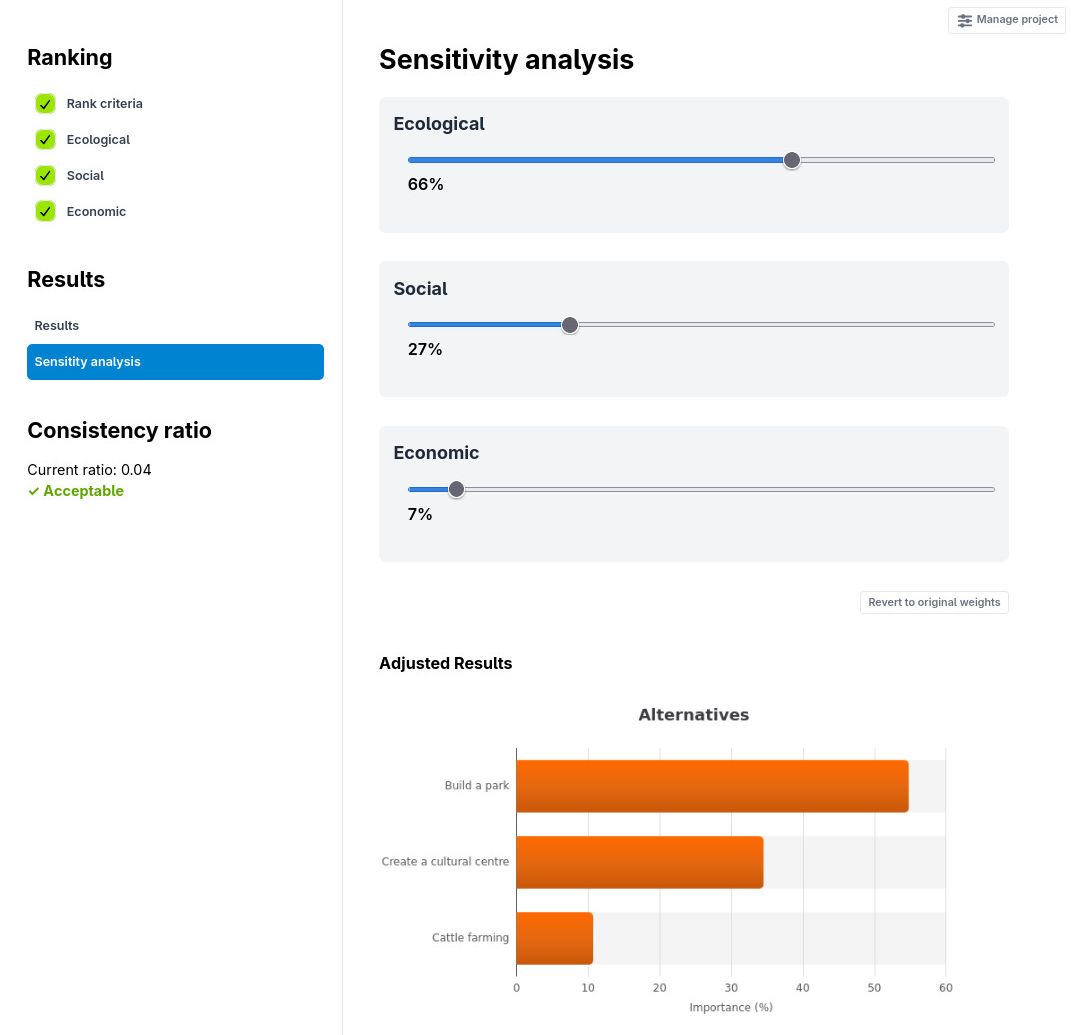
Below you can see what happens if you move the Ecological importance from the calculated 66% to 50% (thus answering the question: how would my result change if I make Ecological less important?).
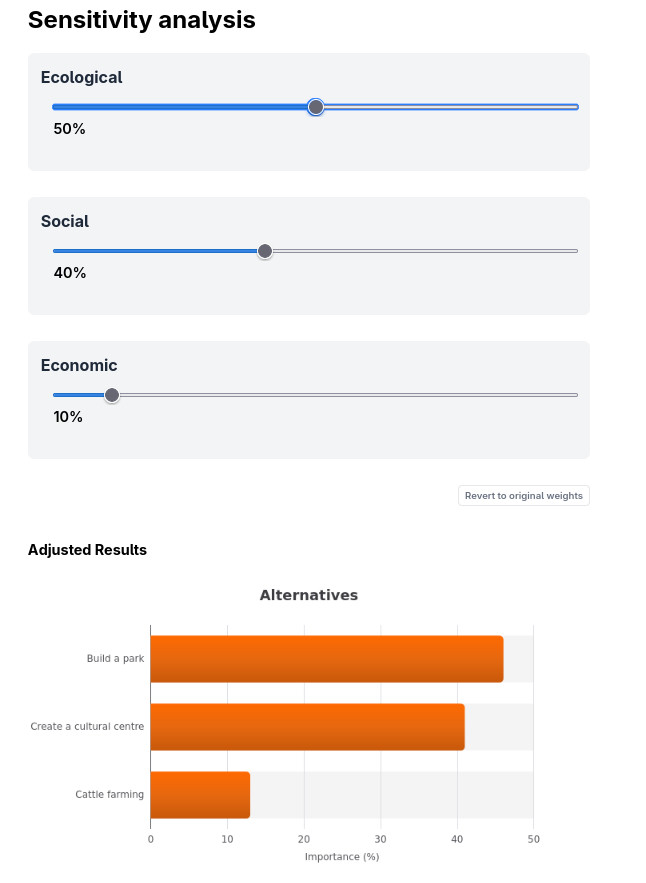
As you can see, the bars in the expected results changed. While the order is still the same, the importance levels of each alternative are different. By moving the sliders around, you can tease out exactly how sensitive the results are to the importance rankings of the criteria. For instance, by continuously reducing the Ecological importance until the rankings change, I can see that an Ecological importance of 44% marks the inflection point: at this percentage Build a park no longer tops the list.
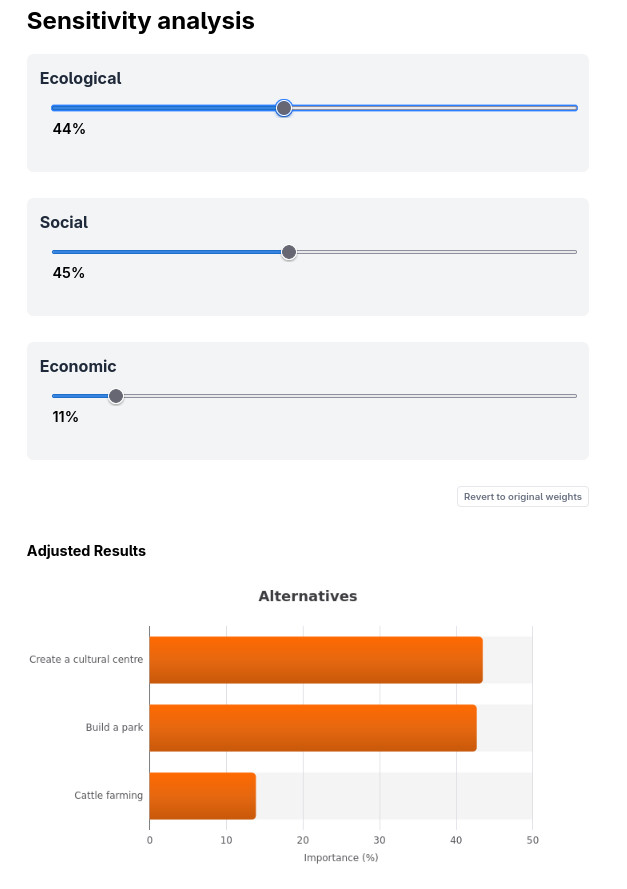
Please note that by changing the importance of one criterion, the importance of ALL other criteria is automatically recalculated. This is done by the system in order to keep the required balance of 100% distributed amongst all criteria.
Additional details: Manage project
The administrator of a project can modify the project at any time by clicking the "Manage project" button shown at the right top of the screen. This will take you to the following interface:
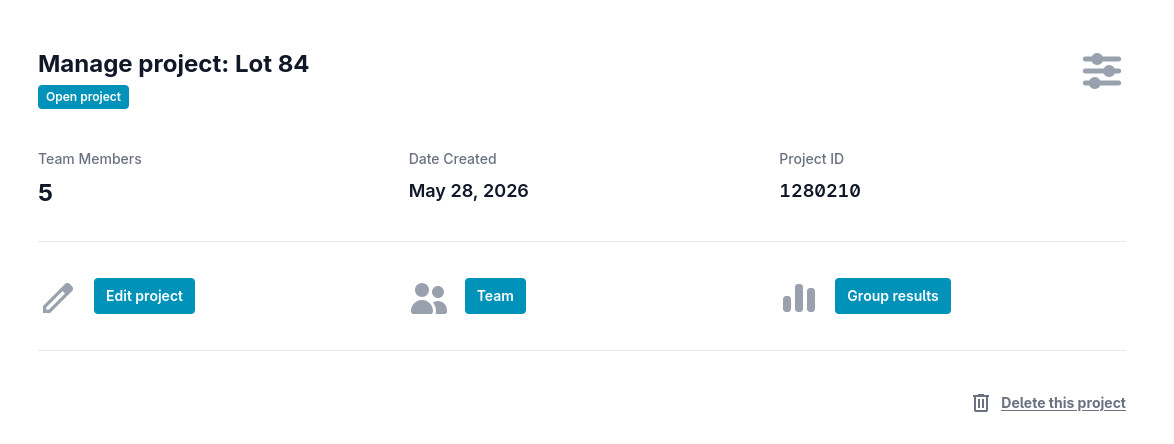
The available options are explained below:
- Edit project: this will take you to a screen similar to the "Create project" screen, where you can enter project details such as the project name, the list of criteria, and the alternatives. Important: make sure that you settle on the list of criteria and alternatives before people fill out their rankings, otherwise they will have to redo this to match your new setup.
- Team: this will take you to the Team page described earlier. You can always revisit this page and invite more people to participate, or remove people from the list.
- Group results: this will show you the results for the entire group (see more below). This button is only visible if you have added a team to your project.
- Delete this project: this will permanently remove your project. If your project has any team members, it will also disappear from their account.
- Open project: this takes you back to your project
Additional details: Group project
If you gave additional people access to your project, then all of these people will be able to fill out rankings in the same way outlined above. They will also be able to see their individual results and perform a sensitivity analysis, exactly in the same way you can do this as administrator. However, as an administrator you can also visualize the group results where ALL results from the whole team are presented. Use the "Group results" button under "Manage project" (see above) to view these results.
The first thing you will see in the group results is an overview of the rankings for each of the team members. You will have a similar navigation menu to the one for a regular project view, but instead of showing sliders that you can modify, it shows a list of sliders displaying the answers of each group member. There is also an AVERAGE shown, which is the geometric mean for that answer, representing the average answer given by your team.
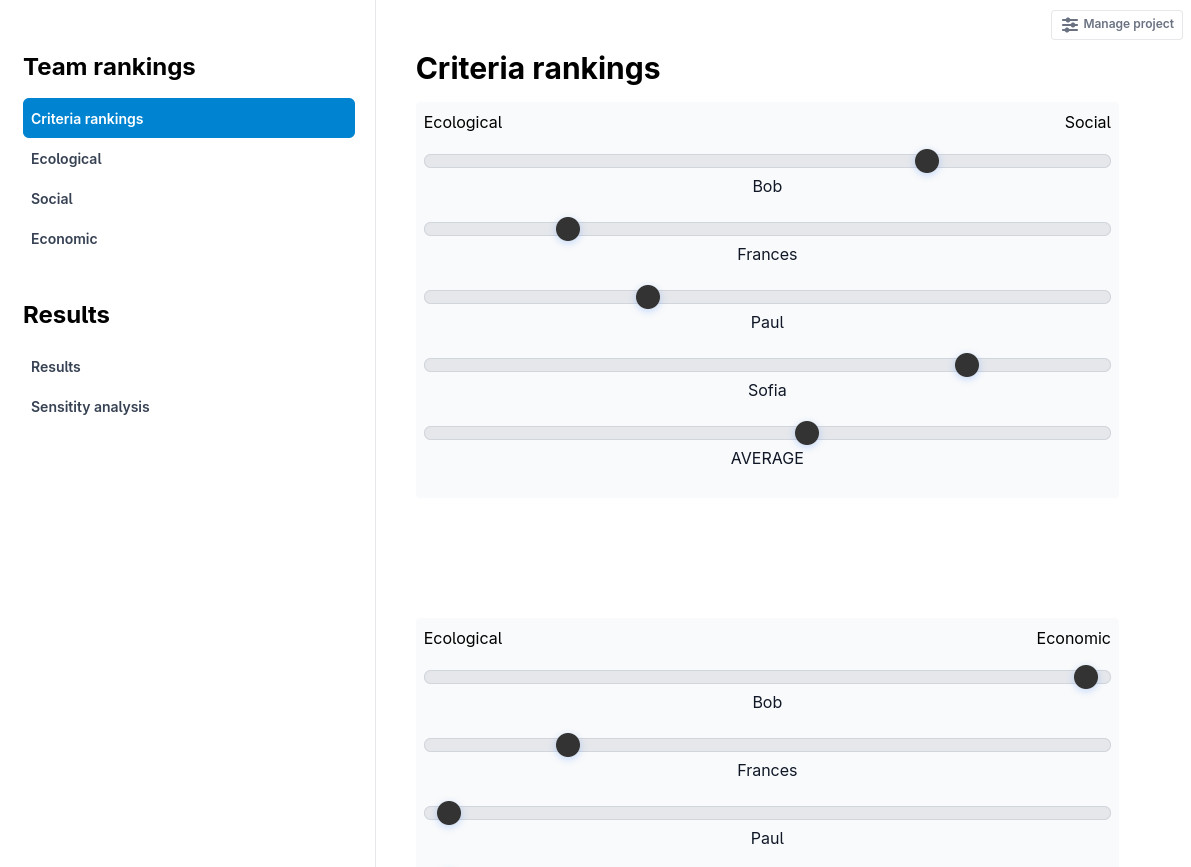
Depending on your group context, you could show the results to the team and discuss the answers to better understand everybody's motivations and values. If the discussion leads to a better understanding of everybody's points of view, that might lead to improved and more broadly accepted decision making.
In addition to viewing the answers to each question, you can also visualize the final group results. The presentation is identical to the individual presentation, but in this case the group results are shown based on the average answers presented before.
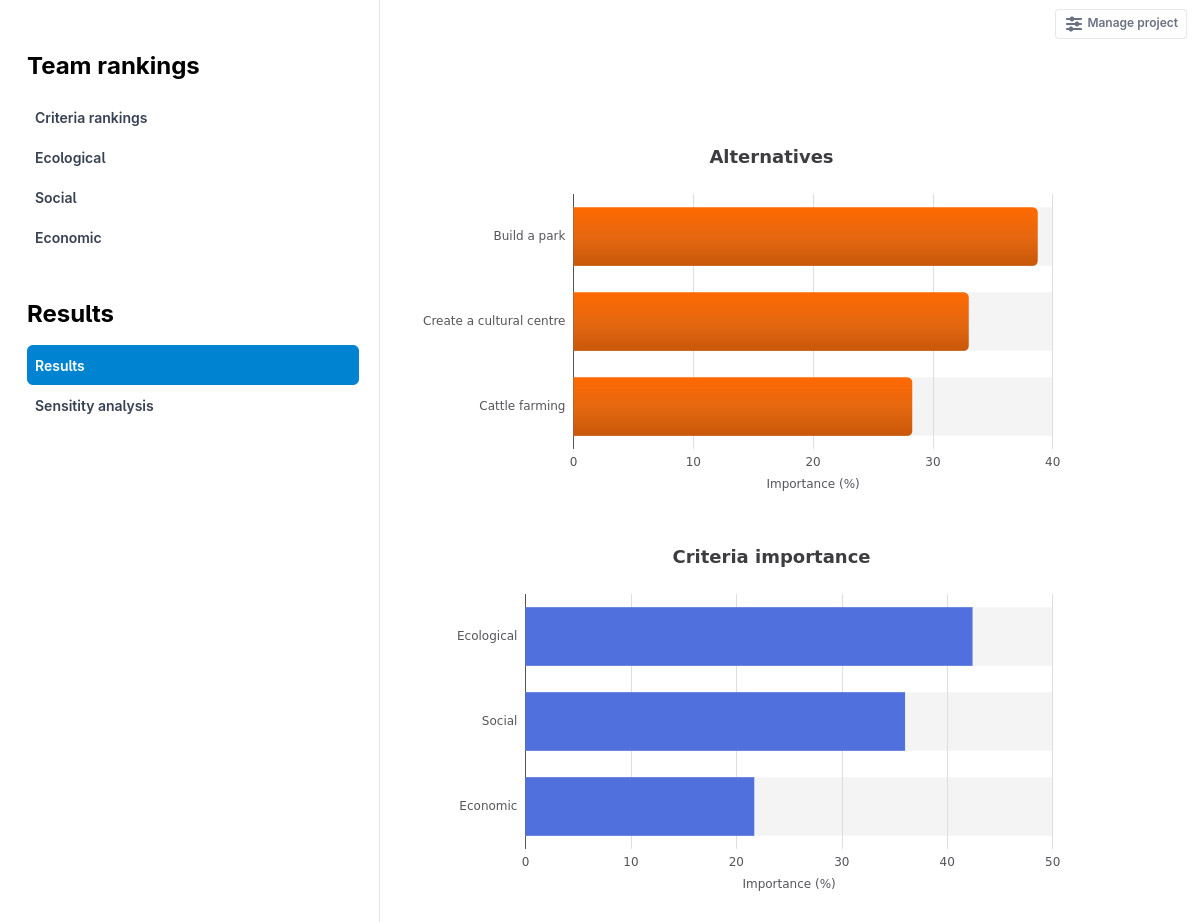
Similarly, there is a sensitivity analysis available to see what the impact would be of changing the importance. This is identical to the personal sensitivity analysis but it is based on the group results instead.